Pyruvate dehydrogenase complex deficiency
Pyruvate dehydrogenase complex deficiency (PDCD) is a rare metabolic disease which affects carbohydrate metabolism and energy production. It is caused by defects in one of the enzymes in the pyruvate dehydrogenase complex (PDC) (Pirot et al. 2016). It is an extremely heterogeneous condition with the age of onset and severity of symptoms varying widely between individuals. Individuals which experience onset of symptoms prenatally or during infancy often die in early childhood. Others who develop disease symptoms later in childhood often have neurological symptoms of varying severity but usually survive into adulthood (Brown et al. 1994). The most common symptom is a build-up of lactic acid in the blood which can lead to nausea, vomiting, breathing problems and abnormal heartbeat. Neurological problems such as motor delays, poor muscle tone, seizures and abnormal brain structure, are also common (Pavlu-Pereira et al. 2020).
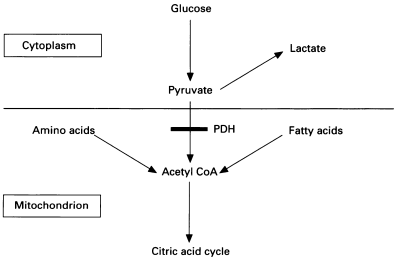 Figure 1: Role of the PDH complex in converting pyruvate to acetyl-CoA (Brown et al. 1994).
The pyruvate dehydrogenase complex catalyses the conversion of pyruvate, derived mainly from carbohydrates, to acetyl-CoA. This is a key regulatory step in the generation of energy from glucose. The complex contains three catalytic enzymes (E1, E2 and E3), regulatory enzymes and a binding protein. The regulatory enzymes are kinases and phosphatases which act to control the activity of the complex by phosphorylation and dephosphorylation (Pavlu-Pereira et al. 2020). We will investigate the protein-protein interactions of these regulatory enzymes using mathematical network methods. The complex also requires a number of cofactors, including thiamine pyrophosphate, lipoic acid and flavin adenine dinucleotide (Pirot et al. 2016). The E1 enzyme, known as pyruvate dehydrogenase, is composed of an alpha and beta subunit. PDCD is most commonly caused by mutations in the gene PDHA1 which encodes the E1-alpha subunit and is located on the X-chromosome (Pavlu-Periera).
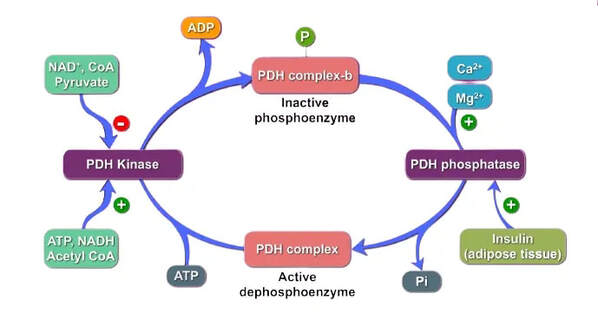 Figure 2: Kinases and phosphatases regulate PDH activity by phosphorylation and dephosphorylation (Sardhara 2021).
Currently, there are no proven effective treatments for PDCD. Ketogenic diets, which are high in fat and low in carbohydrate, are often used to minimise symptoms of lactic acidosis. Dichloroacetate, which inhibits a specific PDH kinase, may be given to activate the PDH complex (Brown et al. 1994). Supplementation with cofactors including thiamine, carnitine and lipoic acid have also been identified as possible options to improve disease outcomes (Pavlu-Pereira et al. 2020).
Target Proteins
Our target proteins are DLAT, LIAS, LIPT1 and NFU1, with yeast homologs LAT1, LIP5, AIM22 and NFU1, respectively. These proteins form the pathway for the metabolism of lipoic acid which is an essential cofactor for the PDH complex. DLAT encodes the E2 subunit of the PDH complex called dihydrolipoamide acetyltransferase which transfers acetyl groups from the oxidative decarboxylation of pyruvate into acetyl-CoA. LIAS encodes an iron-sulphur enzyme called lipoic acid synthase which mediates the final step in the biosynthesis of lipoic acid. LIPT1 encodes lipoyltransferase 1 which transfers the lipoyl moiety to apoproteins. NFU1 encodes the NFU1 iron-sulphur cluster scaffold which assembles and transfers 4Fe-4S clusters to target apoproteins including lipoic acid synthase (National Library of Medicine 2022). These target proteins and related protein-protein interactions will be investigated using both mathematical modelling methods and biochemical experimentation.
Lipoic acid pathway
Lipoic acid is an essential cofactor for many of the complexes involved in metabolism, including PDH. The lipoic acid metabolism pathways vary between yeast and humans. Both yeast and humans are able to synthesise lipoic acid de novo while only humans have a salvage pathway to use exogenous lipoic acid (Storm & Muller 2012).
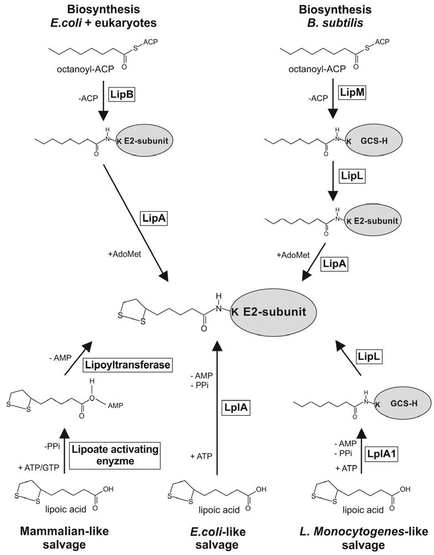 Figure 3: Lipoic acid metabolism pathways vary between different organisms (Storm & Muller 2012).
Mathematical methods
A graph or network is a data structure consisting of a collection of vertices or nodes and edges. Networks are widely used in biology to model the molecular interactions between specific proteins and within biological pathways. (Rajinikanth)
For this project, the protein-protein interactions were mathematically modelled using a graph. The nodes or vertices represented the proteins and the edges represented the interactions between those proteins (Gottwald 2022).
A graph can be directed or undirected, and the edges may have an assigned weight to them (Gottwald 2022). In this project, the protein-protein interactions were modelled using an undirected unweighted graph. The graph obtained from the STRING database contains known protein-protein interactions in yeast (Saccharomyces cerevisiae).
A graph is represented using an adjacency matrix \(A = a_{ij} \), such that \(a_{ij} = 1 \) if the proteins \( i \) and \( j \) have an interaction, otherwise \(a_{ij} = 0 \). (Gottwald, 2022)
Measuring the centrality of the yeast network allows us to determine which proteins are the most significant. Two different centrality measures were used for our experiments - degree centrality and eigenvector centrality. Degree centrality determines the importance of a protein by counting the number of direct interactions it has with other proteins. Eigenvector centrality determines the importance of a protein by analysing the importance of its neighbouring proteins. Betweenness centrality measures the importance of a specific node using shortest paths and allows us to find bottlenecks in a graph. A bottleneck in the yeast network could be defined as a protein that has low degree but high centrality.
In a graph, some nodes may be densely packed and there are more edges linking each other than the other edges in the rest of the graph. Such a densely packed group of nodes is called a community. Community detection algorithms can allow us to partition the graph in a way and evaluate which specific yeast proteins are involved in significant interactions and have interdependent biological functions. One such algorithm is Louvain, which partitions the graph based on modularity. (Gupta 2022)
Modularity of a node is a measure of the density of links within the community compared to the density of links outside the community.
The modularity \( Q \) can be found using the formula:
\(Q = {1 \over 2m } {\sum_{ij} (A_{ij} - {k_{i}k_{j} \over 2m})}\) \( δ(c_{i}, c_{j}) \)
where \( A_{ij} \) is the weight between edges \( i \) and \( j \), \( k_{i} \) and \(k_{j}\) the sum of the weights of the edges connected to nodes \(i\) and \(j\) respectively, \( m \) is the sum of all of the weights of the edges in the graph, and \(c_{i}\) and \(c_{j}\) are the communities of the nodes and \( δ(x,y) \) is the Kroenecker delta function. (\( δ (x, y) = 1\) if \(x = y\), else \(0\)) (Gupta, 2022).
The Louvain method has two steps that are repeated iteratively:
Step 1: Each node is assigned to its own community. Then, for every node, the change in modularity is calculated by removing that node from its own community and moving it to the community of its neighbours. This process is repeated and the node is moved to the community its neighbours are in and the modularity is computed. Afterwards, the node is moved to the community that resulted in the greatest modularity increase. If no modularity increase was computed, then the node stays within its original community. This process is repeated for every node until no more modularity increase occurs. (Gupta, 2022)
Step 2: All of the nodes in the same community are grouped together and a new network is built, and here, the nodes of this new network are the communities from the previous step. Links between nodes of the same community are represented as self loops and links from nodes between edges are represented as weighted edges between communities (Gupta 2022).
The Leiden algorithm is an extension of the Louvain algorithm. One problem with Louvain is that the algorithm may identify communities that are disconnected. This can happen when the algorithm moves a node that acted as a bridge between the components of the old community to a new one. The Leiden algorithm has three phases - locally moving nodes, refining partitions and aggregating the network based on the refinement. Leiden is faster because, unlike Louvain, Leiden does not look at all nodes within the network, but rather looks at the nodes whose community has changed (Traag et al. 2019).
Another community detection algorithm that was used was the Clauset-Newman-Moore greedy modularity maximisation. This algorithm finds the community with the greatest modularity. The algorithm starts by assigning each node to its own community and then joins the pairs of communities over and over until the maximum modularity is reached. There are two parameters that is used to adjust when the partitioning stops. The cutoff is the lower bound on the number of communities and the algorithm stops before reaching the maximum. There is also an upper bound that can be set to limit the number of community partitions created. (Greedy_modularity_communities#)